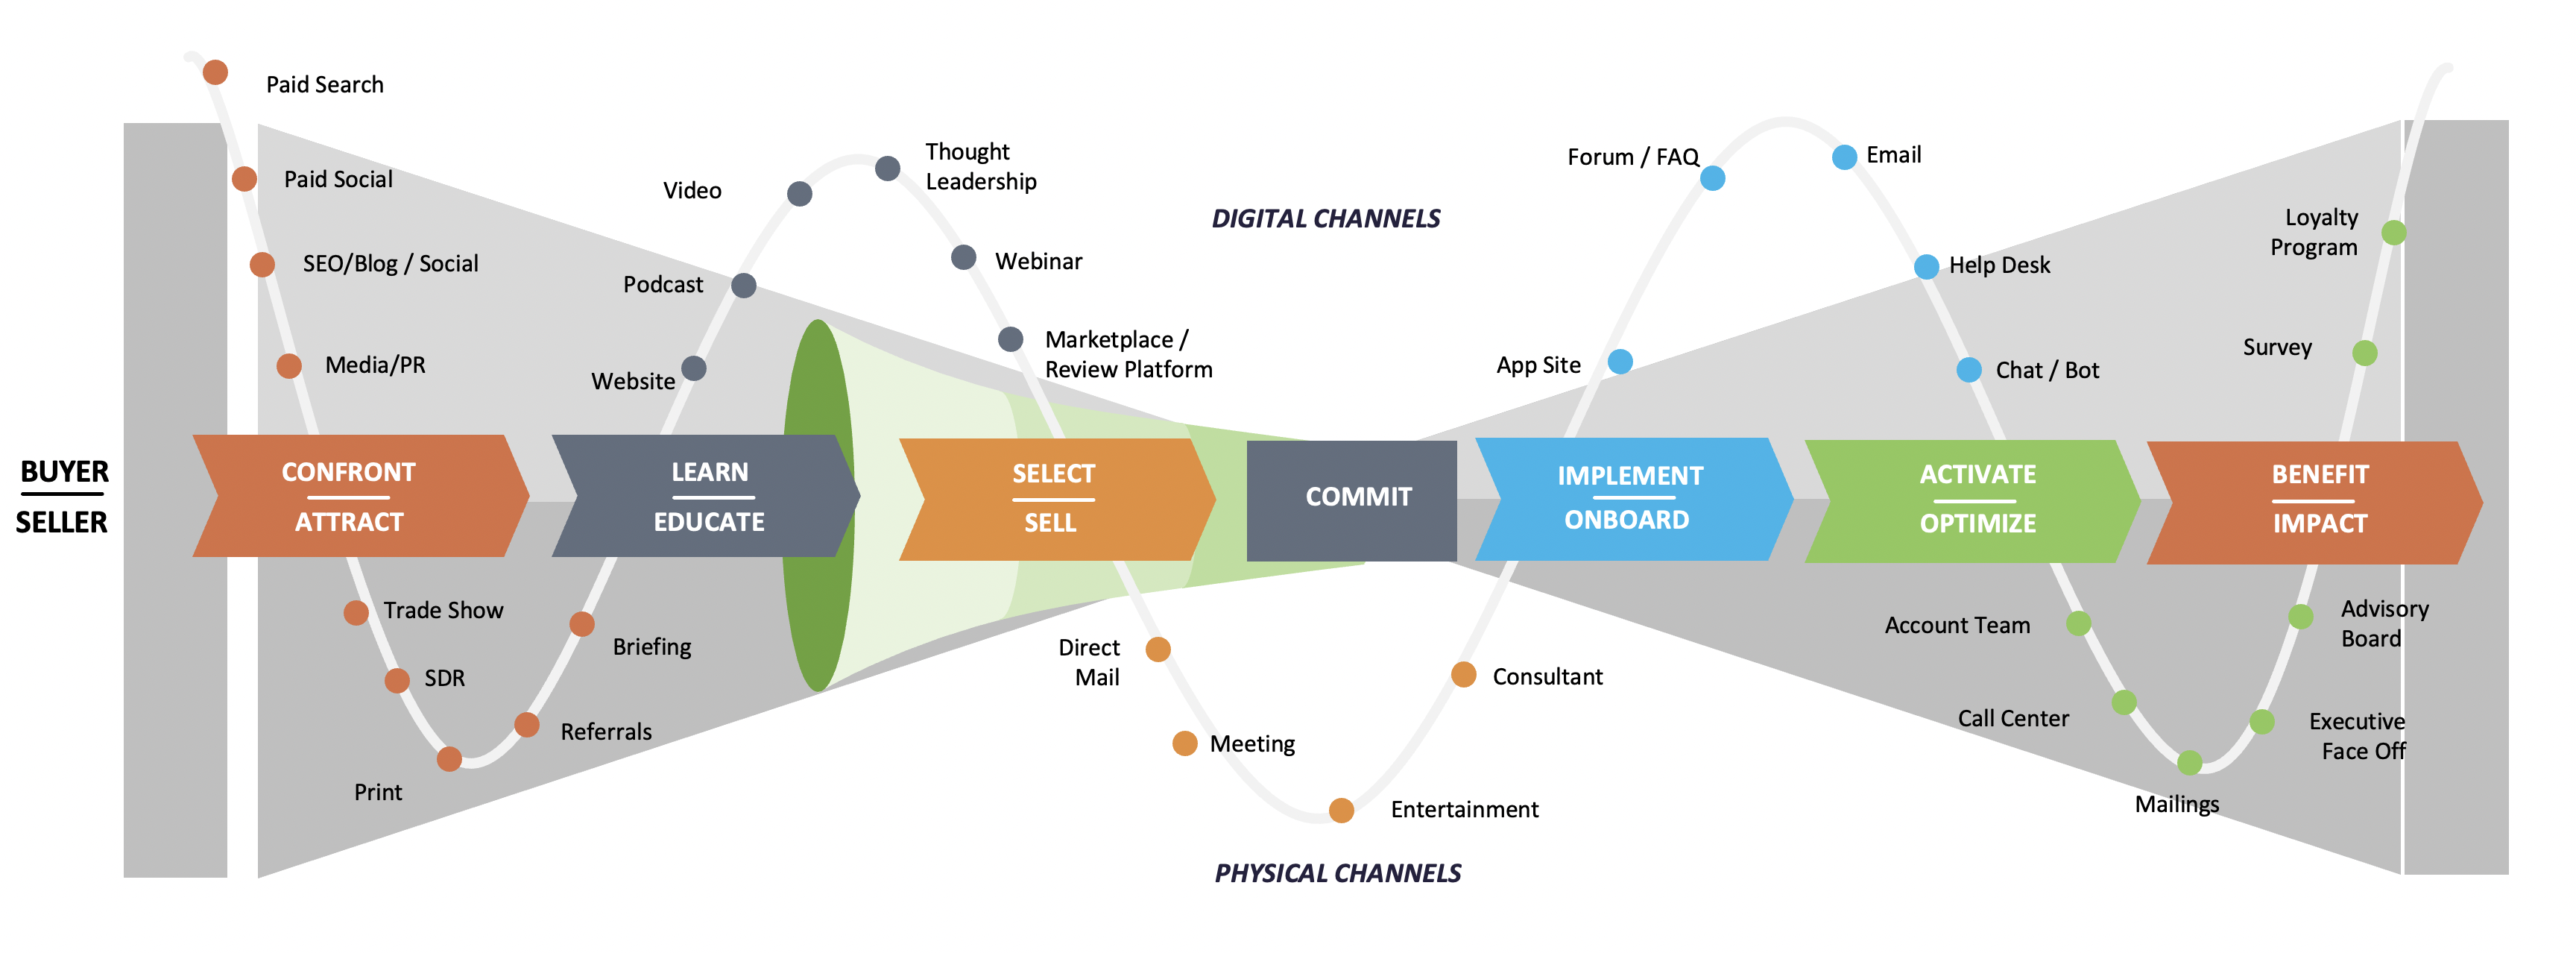
Creating Logical Pathways™: How to build a clear engagement path via content – to advance buyers and increase conversion through the buy cycle by 300% or more!
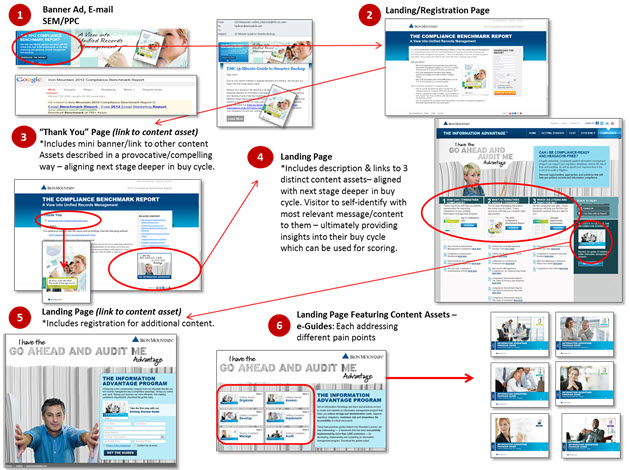
It’s crucial to buyer advancement and conversion to seed content in logical, sequential parts of your buyers’ UX (user/visitor experience) by using your various digital assets/properties. It allows you to use “guided selling” techniques to capture additional depth of understanding via progressive profiling. One good content asset deserves an even better one, and then an even better one after that.
Or…to put it another way: By providing increasingly attractive incentives on each successive page of your digital properties (website, registration, thank you or landing pages, etc.), you’ll be able to focus prospect behavior and streamline data capture. It works very simply: upon their registration for an initial asset for which you ask for only minimal information, pull prospective buyers further into their journey with an even stronger content offer of higher perceived value — provided, of course, that they take the “next step” you’ve guided them towards.
See for yourself how this is a powerful tool for engaging prospects and collecting essential information about their companies, current situation, challenges, pain points, needs, and stage in the buying process. The value in monitoring and analyzing their digital body language is vital.
It’s all about leaving breadcrumbs along the conversion path you want your prospective buyers to follow. And always, define calls-to-action everywhere (social media, blog posts, landing pages, on your website, in automated lead nurturing e-mails, via links within all types of content assets such as eBooks, guides, etc.). What do you want the buyer who consumes content to do next? (Below is just one simple example of the practical application of this principle.)
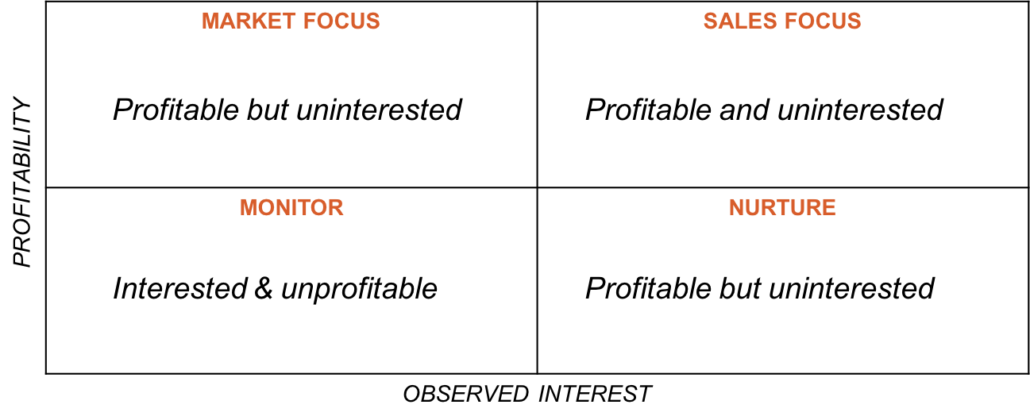
What questions are buyers trying to answer at the early and middle stages of their buying process?
Your content should help specific audiences (i.e., Engagement Personas™) answer questions like, “do I have a problem?” or “do I have THIS problem?” and “how should I solve it?” You’re attempting to surface pain-in-the-present and demand long before the conversation shifts to what solution is best. Your solution is obviously the best, but TRUST is what makes it obvious to a discerning buyer.
To that end, one of the most valuable aspects of Engagement Personas™ when they’re constructed effectively, is to anticipate and answer the questions a buyer would ask at each step of the process. If you have content that answers them in a way that’s relevant to the specific prospective buyer, fantastic. If you don’t, then that’s where you start. The other suggestion for enabling Engagement Personas™ to drive strategy is to develop engagement scenarios.
E-BOOK: Exposed. The False Promises of Revenue Marketing.
 We published an e-book series that describes the 9 Principles of Effective Buyer Engagement. These principles serve as a practitioner’s guide to increasing leads, conversions, pipeline velocity, and revenue impact.
Volume: Generate “Top-of-the-Funnel” Visits & Inquiries
Value: Get Better Qualified Inquiries
Velocity: Increase Conversion Rates
Revenue: Optimize Engagement for Revenue Impact.
Get a copy of your e-book here.